Structured Roots helps clients to see their operations as a whole system - connected, dynamic, and shaped by the people doing the work. We build your ability to notice patterns, understand relationships, and balance growth with quality by ensuring both respect for people and resources.
We teach practical skills in a clear way to design processes—so you can solve problems, drive quality, and design systems that support real outcomes.
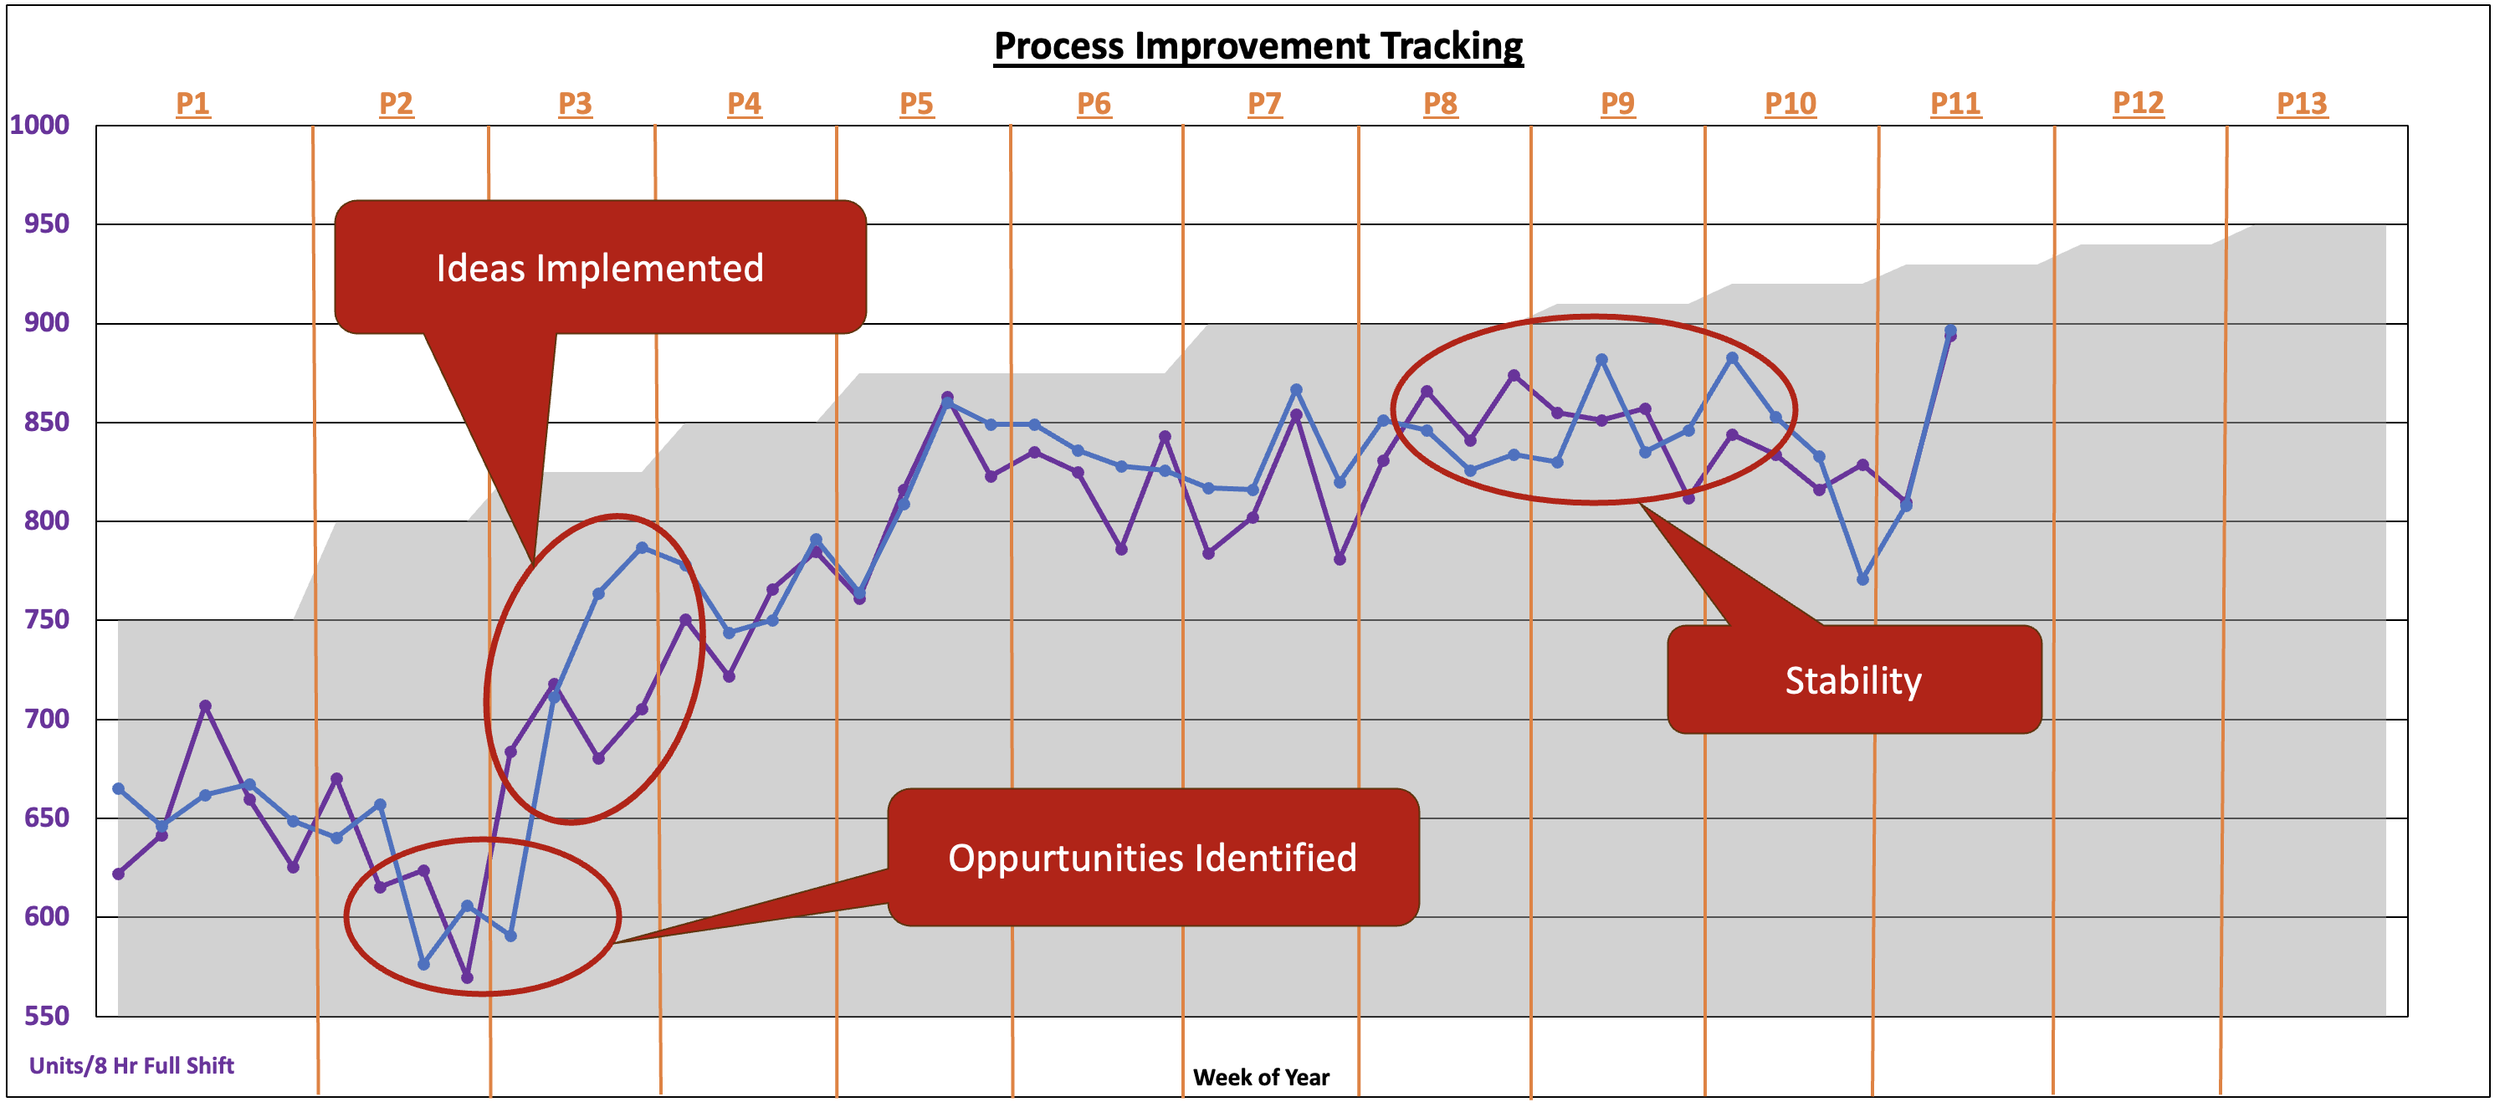
Clients have seen up to 40% growth without capital investment—just by learning to see their systems differently. From small adjustments to full strategy, we transfer knowledge so you can keep improving while avoiding burnout and over investment before sales can support it.
With systems grounded in respect—for time, resources, and people—your business becomes a place where steady change and real innovation can take root.
This approach builds a culture of continuous improvement, effective time use, and sustainable growth.
Services
We offer custom service packages tailored to each client’s needs, ranging from support for individual processes to ongoing assistance for entire operations.
In every case, we use work measurement techniques to teach and empower clients, ensuring that continuous improvement efforts remain sustainable.
Our custom packages can include:
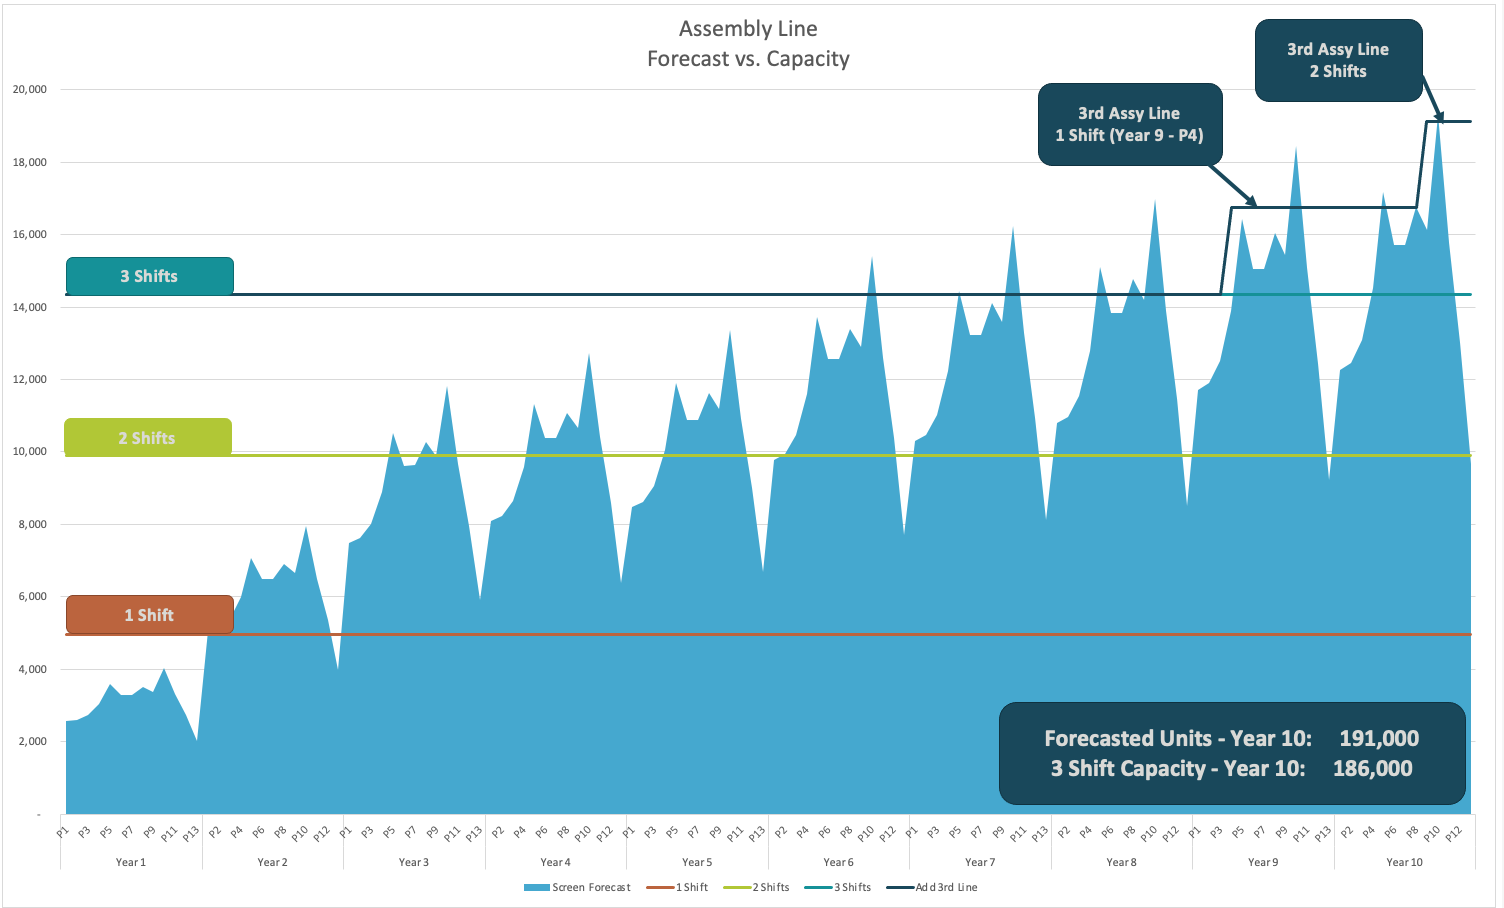
Capacity analysis
What can you actually produce?
Scalability plans
How to strategically expand?
Lean manufacturing principles
Streamline operations
Designing with respect for people
Put people first
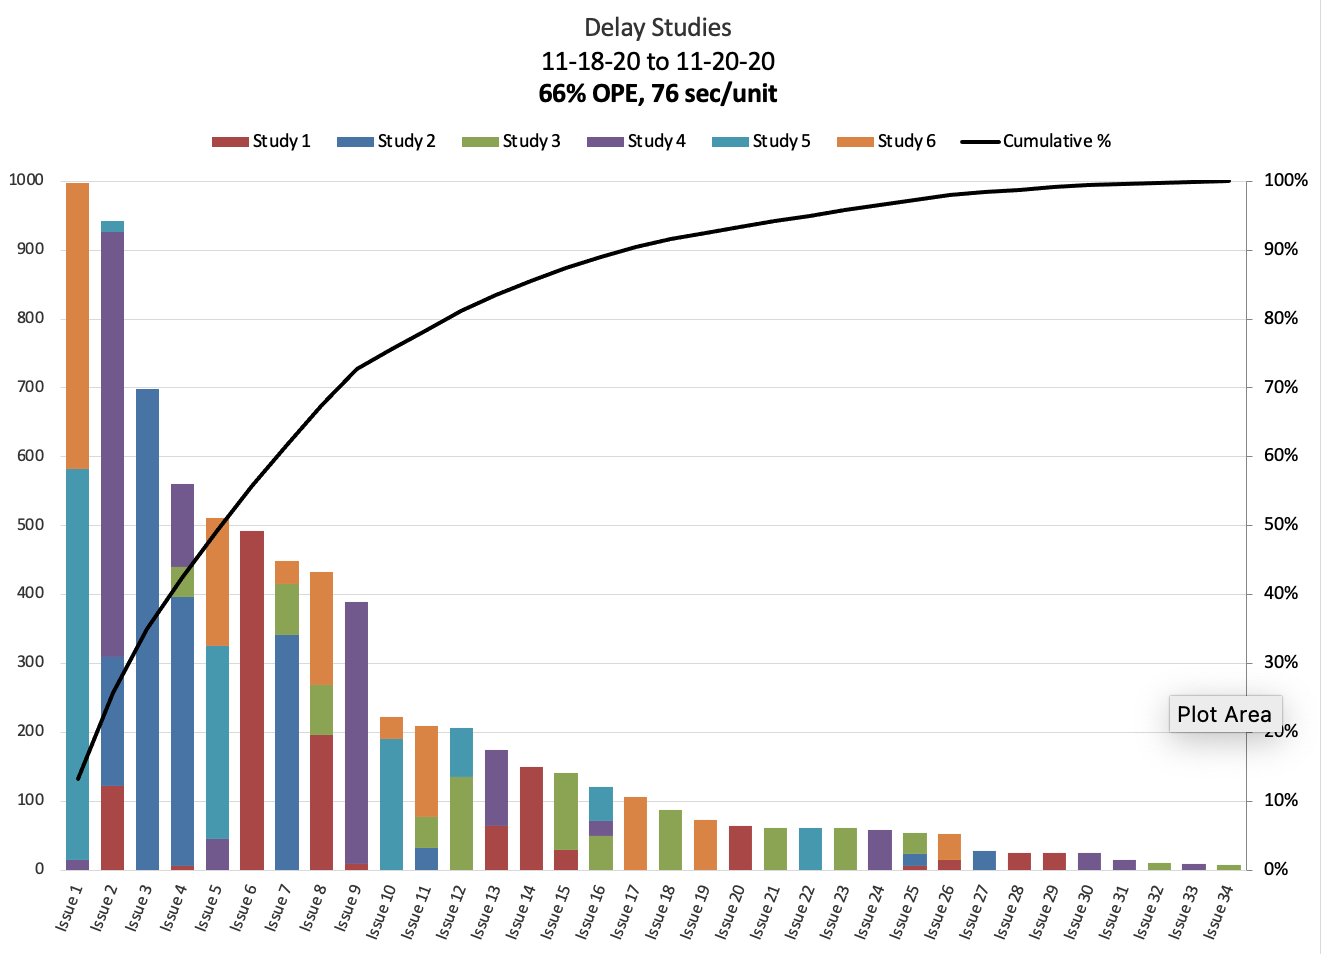
Efficiency optimization
Balance efficiency with effectiveness
Manage quality with growth
Improve quality while growing
Contact Us
Interested in working together? Fill out some info and we will be in touch shortly. We can’t wait to hear from you!
Start with a free consultation!


